All software

Live timing & race strategy

FB iRPitwall

The whole race. In your corner.

For teams managing a race, drivers reading the traffic and engineers comparing pace. Follow iRacing with live timing, track maps and pit strategy, then examine the session from a workspace built around your decisions.

Windows desktopiRacing

From live timing to a race decision

Follow the field. Put every stop in context.

Keep the race picture and the detail within reach. A collector captures iRacing on the simulator PC; the desktop viewer turns that session into separate windows for timing, traffic, strategy and analysis.

  1. Connect your session

    Run the collector on the Windows PC running iRacing. Connect the viewer on that PC or another computer on the local network, then choose the event and session.

    Explore this step
  2. Build your race view

    Choose a window profile, focus a car and select the drivers you want to follow. Open Timing, Relative and a map to connect class position with traffic on the road.

    Explore this step
  3. Investigate the next decision

    Check pit activity and the estimated pit window before considering a stop. Use race traces, lap comparisons and tables to understand the pace behind the position.

    Explore this step

The current product uses Windows desktop apps. The collector stores session history locally; the viewer can connect on the same PC or across the local network.

Inside FB iRPitwall

A race picture you can arrange around your role.

Explore 24 views of your desktop pit wall. Scroll through live timing, maps, pit strategy and analysis, and see how each window supports your race decisions.

01/ 24Session collectorScroll to explore

Your workspace

Session collector

Collector

Choose a source, capture the session and feed your desktop pit wall from a local server.

What to look for

Check capture status, event, session time and the counts of cars, laps and snapshots. The screenshot uses a saved Recording; live iRacing capture requires a valid licence. The window shows the local server address and the database that stores session history.

Make it your own

Choose live iRacing, a Recording or a simulated race, then start or stop capture. Enable raw recording or capture on launch when needed. Use Open viewer to begin analysis. Closing or minimizing leaves capture running in the tray; Quit ends it.

Live race

Live timing

Timing

Keep positions, gaps, sectors and pit activity together in one timing tower.

What to look for

Read last and best laps, sector and microsector colours, stint length, stops and recent pace alongside race status. GAP and INT can follow the overall order or the class view. The reference trace helps show how a car's comparison is changing.

Make it your own

Choose a class, toggle By class, select useful columns and click a row to choose the reference. Click it again to return to the class leader; other classes retain their own leader as reference.

Live race

Timing split by class

Timing · Split by class

Give each class its own race picture without mixing its positions and gaps with other classes.

What to look for

Separate blocks show each class with its own order, GAP and INT. Class colours and best-sector highlights make the different battles easier to follow. A class leader can still have traffic from other classes nearby on the road.

Make it your own

Enable Split by class in Timing and use the class selector to narrow the field. Keep Relative or the track map beside it to distinguish class competition from physical traffic.

Live race

Nearby traffic

Relative

See the cars physically ahead and behind your focused car, even when their race positions differ.

What to look for

The relative view wraps positions around the lap. Positive values are ahead and negative values behind. The seconds are estimates based on pace and the track's time profile, not the same measurement as the timing tower's race gap.

Make it your own

Focus the car you want to follow, choose driver or team names and set how many cars to show on either side. Read it with the map when preparing for traffic or a rejoin.

Maps & traffic

Track map

Track map

Place the field, sectors and pit activity on the circuit outline.

What to look for

Class-coloured markers show where cars are around the lap. The PIT ghost places the focused car back along its recent path by the assumed pit-loss time, helping visualize a possible rejoin. It is a projection, not a guaranteed exit position.

Make it your own

Select a car on the map, choose which cars stay visible and toggle the PIT ghost. Unlock the viewport to zoom or move the map, then compare the projected location with Pit strategy.

Maps & traffic

Race ring

Ring

Read the same field on a circular lap view that keeps relative spacing easy to scan.

What to look for

The ring shows lap progress, class colours, sector boundaries and the focused car. It is a schematic view, not the circuit's physical shape. The pit ghost uses the same estimated pit window as the track map.

Make it your own

Focus a car, filter visible cars and toggle the PIT ghost. Use the ring beside Relative for traffic awareness, or switch to the track map when the shape of a corner matters.

Pace & analysis

Race trace

Race trace

Follow how a battle develops across laps and sectors against a chosen reference.

What to look for

The trace compares when each car reached the same race-distance point. Positive seconds mean behind the reference; negative mean ahead. The chart places the faster side above the zero line, while stops and interruptions can create large changes.

Make it your own

Choose a reference car and class scope, set the lap range and vertical scale, or use automatic scaling. Explore an earlier section and use Live to return to the current race picture.

Pace & analysis

Compare a lap by distance

Lap compare

Locate where a car gains or loses through the lap, with speed, delta and sector comparisons.

What to look for

The speed curves are derived from captured distance and time, then smoothed; they are not private pedal or steering telemetry from rivals. Delta is cumulative: positive loses, negative gains. A running lap ends where the captured car has reached.

Make it your own

Choose the reference car and its last, best or current lap, then select the cars to compare. Inspect the speed and delta at the same distance and check the sector table as each sector completes.

Pits & stints

Pit-stop history

Pit stops

Compare stints and stops across the field, then read the individual stop details.

What to look for

The timeline separates running stints from pit periods. The table lists entry time, lap, time in the lane, stationary time, reported tyre changes and driver context. Time in the lane and time stopped describe different parts of the visit.

Make it your own

Scroll through the cars and stop records, hover the timeline for details and select a car to focus it. Resize the timeline/table split.

Pits & stints

Pit lane live

Pit lane

Follow who is entering, stationary or back on track while the stops unfold.

What to look for

Active cars appear first with separate lane and stop clocks. Completed visits remain dimmed below, with how many laps have passed since exit. A check indicates the capture saw the full visit; unusually long race stops are highlighted against class history.

Make it your own

Keep this panel beside Pit strategy and Pit stops to separate an ongoing service from a completed loss. Focus the car you are following and pin the window where the stop clocks stay visible.

Maps & traffic

Pit-lane map

Pit lane map

See the pit lane unfolded from entry to exit, with moving cars and stationary service positions.

What to look for

Cars travel along the fast lane and move into the service row while stopped. Lane and stop timers add context. The layout uses learned telemetry and map information, with an estimated fallback; the drawing is a schematic, not a survey of exact garage positions.

Make it your own

Click a car to focus it and watch its movement beside the Pit lane clocks. Read the source label at the bottom to see whether the lane extent comes from telemetry, the map or an estimate.

Pits & stints

Pit window & rejoin

Pit strategy

Test what a stop could mean for position within the focused car's class.

What to look for

The pit window combines typical moving loss and stationary time, using measured stops, circuit history or a default. Rejoin estimates the neighbours after a stop now. Net equalizes observed stop counts within the class; it does not know every rival's fuel plan.

Make it your own

Choose the class, inspect the automatic window's source or enter and lock a manual loss. Compare the projected position and margins with actual pit activity. A free-stop marker depends on that assumed loss and the current gaps.

Pits & stints

Tyre strategy timeline

Tyre strategy

Compare the timing and length of tyre stints across each class.

What to look for

Bars place reported compounds and stint lengths along the lap axis, with the current stint extending as the car progresses. A pit visit does not prove a fresh set: rival tyre replacement is generally unknown unless a compound change reveals it.

Make it your own

Choose visible cars, hover a row for detail and select a car to focus it. Read the timeline alongside lap pace and weather before interpreting a shorter or longer stint as a tyre advantage.

Pits & stints

Tyre stints at a glance

Tyre stints

Keep each car's sequence of compounds and stint lengths in a compact class-grouped list.

What to look for

Badges summarize completed laps in successive stints. New-set information is shown only when supported by the captured data; unknown does not mean unchanged. Stint length describes the run between stops, not a measured remaining tyre life.

Make it your own

Select a car to focus it and hover its row for more detail. Keep the list beside the tyre timeline or lap-time chart to connect the stint sequence with pace.

Live race

Race messages

Messages

Keep flags, pit events, driver changes and class fastest laps in a time-stamped log.

What to look for

The latest messages appear first with their time, category and car. They provide a sequence for understanding a timing change or interruption. These are captured session events, not a messaging channel between team members.

Make it your own

Toggle Flags, Pit stops, Drivers, Fastest laps, Status and Session, or show only the focused car. Select a car-related row to bring that car into focus.

Pace & analysis

Lap-time evolution

Lap times

Compare pace and consistency across a run instead of judging only the fastest lap.

What to look for

Each line follows a selected car's lap times. Hollow points at the top mark laps with pit stops so they remain visible without flattening the normal pace range. Traffic, conditions and stint phase still matter when the curves separate.

Make it your own

Select cars with the people button and choose all laps or a recent range. Keep the tyre-stint and weather views nearby when investigating a sustained pace change.

Pace & analysis

Gap to the class leader

Gap to leader

Follow the race deficit at the timing line, lap by lap.

What to look for

Each point compares a car's crossing time with the first car in its class to complete that same lap. Zero is at the top and larger deficits extend downward. A stop can reshape the graph before the pit cycle settles.

Make it your own

Choose the cars and lap range, then compare a change with Pit stops or Race trace. Remember that cars from different classes are measured against their own class leaders.

Pace & analysis

Positions by lap

Positions by lap

Trace changes in class order across the race, with the whole class kept in view.

What to look for

Each line shows class position by completed lap, with the leading position at the top. In races, the order comes from when cars completed the same lap; other session types use the reported class position. Position changes can reflect pit cycles as well as on-track battles.

Make it your own

Choose the focused car's class or another class, select all laps or a recent range, and use the people button to highlight cars. Selected cars appear in colour; the rest of that class remain grey. Compare a change with Pit stops and Gap to leader.

Live race

Weather evolution

Weather evolution

Keep current conditions beside the history that may explain a change in pace or tyre choice.

What to look for

Air and track temperatures, wind, humidity, surface state and rain give session context. Shading distinguishes rain from a wet track without rain. The history uses leader laps during a race and session time otherwise; it is observed weather, not a forecast.

Make it your own

Read the temperature and wind plots together and compare their timing with stints or lap-time changes. Pin or resize the weather window to retain the conditions you need beside your main race view.

Maps & traffic

Track dominance

Track dominance

See which selected car is fastest in each microsector of the circuit.

What to look for

Each section takes the colour of its quickest selected car. Compare each car's best microsector times or its last complete lap. Only the class of the first selected car is compared; selected cars from other classes are left out and identified.

Make it your own

Choose cars with the people button and switch between best microsectors and last lap. Use the counts and coloured map to choose a section for Lap compare; best sections can come from different laps.

Pace & analysis

Data tables & CSV export

Data tables

Move from a visual pattern to the individual lap, summary or microsector values.

What to look for

Laps lists times, sectors, compounds, stint, recent averages and flags. Summary compares best laps, sectors, an ideal estimate and clean-lap pace; Microsectors compares each car with its class benchmark. Missing values and pit or caution flags remain meaningful context.

Make it your own

Choose Laps, Summary or Microsectors, set the recent-lap range and filter cars. Use Export CSV to save the visible tab, or select a car row to focus the rest of your analysis.

Pace & analysis

Microsector editor

Microsectors editor

Divide the circuit into useful sections for braking, corner exit and pace comparisons.

What to look for

Automatic cuts use a reference speed profile around braking and corner exits while respecting sector boundaries. The map, distance table and profile show each cut. These are analysis sections calculated by Pitwall, not additional official timing loops.

Make it your own

Drag a cut, double-click to add one or remove a selected cut. Use Automatic to recalculate, or lock the cuts to save them for the circuit. Review the resulting divisions in Timing, Track dominance and Data tables.

Your workspace

Choose the cars to follow

Drivers

Build a shared selection for the charts, then refine an individual view when needed.

What to look for

The Drivers window groups cars by class and shows which are selected. The focused car and its class leader offer a useful starting pair. Chart selection and physical proximity answer different questions; selecting a car does not put it nearby on track.

Make it your own

Tick individual cars or a class, choose all, or start with Focused car + leader. Use a chart's people button to adjust its own selection without rebuilding the whole workspace.

Your workspace

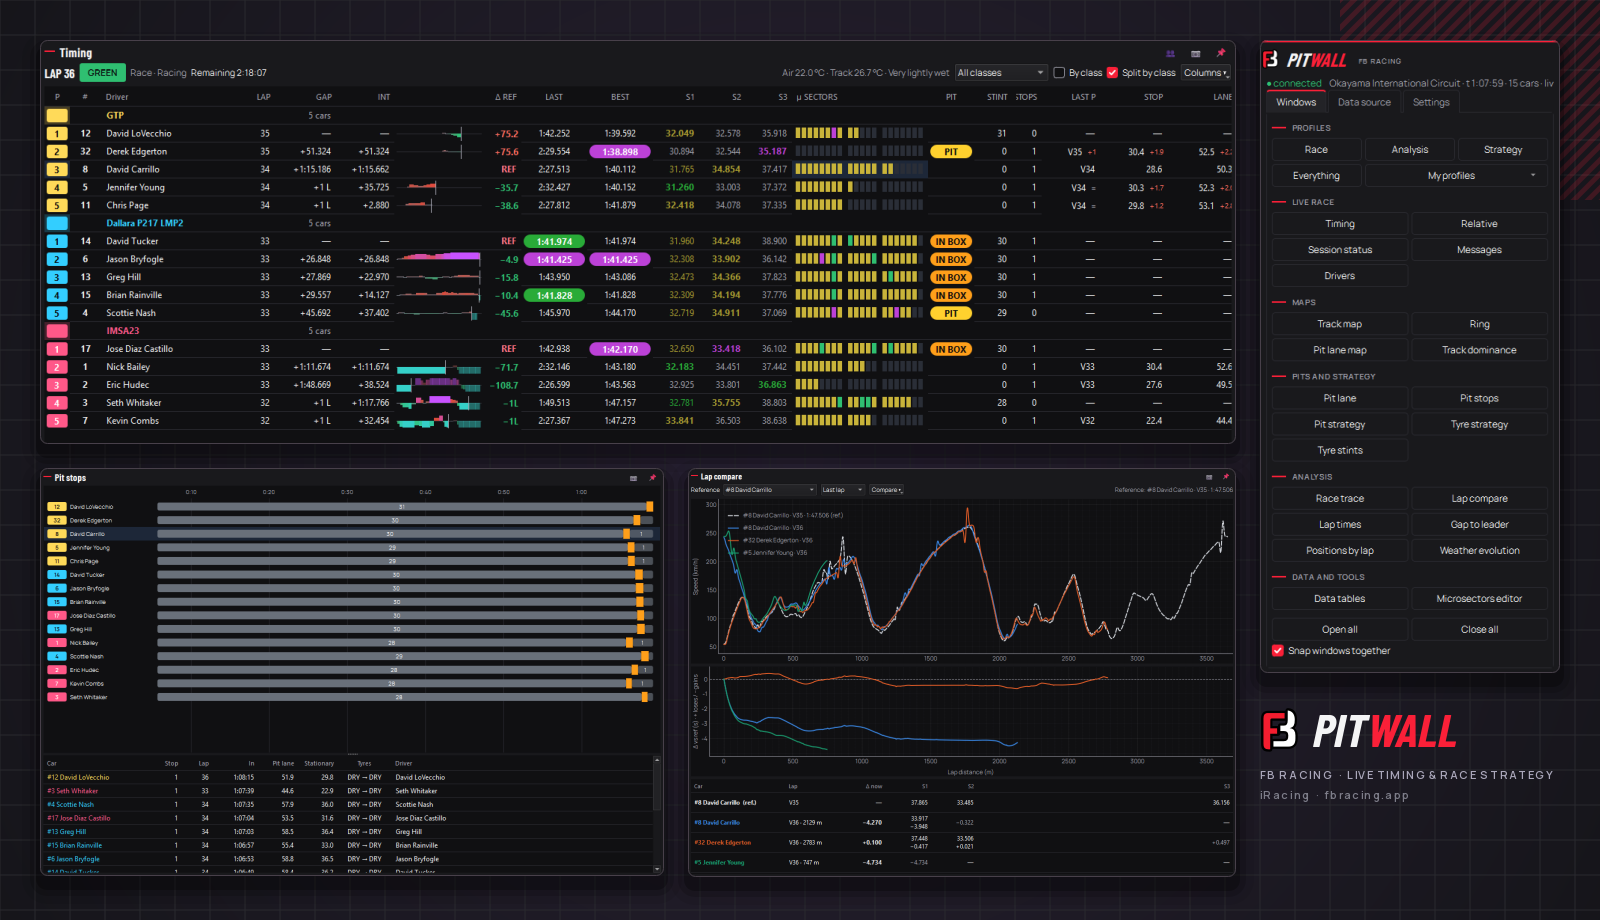
Your desktop pit wall

Control · Windows

Arrange independent windows around driving, engineering or race management.

What to look for

The Control window selects the data source, event and session, then opens the views you need. Race, Analysis, Strategy and Everything profiles provide starting layouts; your own profiles preserve a preferred arrangement.

Make it your own

Open or close views, snap their edges together and save a profile. Pin a window above others, adjust its opacity and use the camera button to save a PNG and copy it to the clipboard. Set the application language in Settings.

Actual desktop application screenshots. Available information depends on the session and captured data; estimates need the context described in each view.

Build your race view

Start with the decision in front of you.

Follow these routes to connect the race picture with its supporting detail. Each link opens the relevant view in this guide.

Keep the right information within reach.

01One focused car

Select a car in a supported table or map to focus the linked views. Use Drivers for the shared chart selection and a view's people button for local selection or visibility.

02A layout for each role

Open the windows from Control, choose a built-in profile or save your own. Snap windows together and resize them to fit the information you need.

03Keep a view on top

Use the pin button to keep a window above others and adjust its opacity. This is useful for retaining a relative panel or pit clock beside the simulator.

04Capture a useful moment

The camera button saves the window as PNG and copies it to the clipboard. Capture the view with its reference, class and assumptions visible.

05Take the numbers with you

Open Data tables, choose a tab and range, then export the visible table to CSV. Keep lap flags and session context with the numbers you review.

06Return to a session

Use Control to select the data source, event and session. The collector keeps local timing, stop, message and weather history; detailed recent traces have a different retention from that stored history.

Understand the data

Know what is measured and what is projected.

Pitwall connects the information available from iRacing with calculated timing and strategy views. A useful decision still depends on the right class, reference and assumptions.

Timing and nearby traffic differ

Race gaps use captured passage times at the same race-distance point. Relative seconds estimate travel between nearby cars from pace and a track profile. Lap-compare speeds are derived and smoothed from distance and time.

A pit window is an assumption with evidence

Automatic loss estimates use available race stops, circuit history or a default; you can lock a manual value. Net compares stop counts and rejoin adds the assumed loss to current gaps. Neither reveals rivals' fuel loads nor guarantees their future strategy.

Tyre knowledge has limits

Compounds and stints come from captured session data. A rival staying on the same compound does not reveal whether a new set was fitted. Fresh-set information must remain unknown where the available data cannot establish it.

Coverage and class context matter

Official lap times are used where available; sectors and microsectors are calculated from captured samples. Missing data can leave incomplete sections. Class comparisons, current conditions and the chosen reference must stay visible when reviewing results.

Good to know

Do the collector and viewer need to run on the same PC?

No. The collector runs on the Windows simulator PC, while the desktop viewer can connect on that machine or another computer on the local network.

Can I review a session after the live capture?

The collector stores session history locally, including laps, stops, messages and weather. Select the stored event and session in the viewer. Detailed distance traces cover recent captured running and are not equivalent to unlimited archived telemetry.

Does Pitwall know rivals' fuel loads or every tyre change?

No. Pit-window and Net calculations use observed stops and timing assumptions. A rival's fresh tyre set is generally unknown unless the available data, such as a compound change, establishes it.

Does Net predict the final classification?

No. It shows a virtual class order after equalizing observed stop counts using the chosen pit loss. Future pace, traffic, further stops and changing conditions can alter the outcome.

Can I share the analysis?

Save a view as PNG with the camera button, which also copies it to the clipboard. Data tables can export the visible tab to CSV for review outside the application.

FB iRPitwall

Make it part of your workflow.

Find out more about this product or manage your existing licences.

Account

Use ← → to browse and Escape to close.