All software

Telemetry & replay analysis

IBT Replay Viewer

Your lap. A whole new perspective.

For drivers refining a lap, engineers investigating the car and teams reviewing a session. Turn your iRacing .ibt recordings into linked telemetry, track maps and lap comparisons, then return to the same moment in the replay.

Windows desktopiRacing

From a recording to an explanation

Find the moment. Understand the difference.

A lap time tells you the result. Follow the inputs, the car and the track together to investigate how it happened. Start with one question and open the views that help answer it.

  1. Open your session

    Choose your telemetry folder and a .ibt file. Review laps, sectors and the session context before picking a completed lap.

    Explore this step
  2. Choose your reference

    Compare another lap from the same session or another file on the same track. Dashed traces and a time delta make the comparison easier to follow.

    Explore this step
  3. Connect data and replay

    Move the cursor through charts and the map. With the matching replay open in iRacing, follow its position or use Ctrl+click to jump back to the moment you are studying.

    Explore this step

Telemetry analysis works from your local files. Replay synchronization needs iRacing and the matching session replay.

Inside IBT Replay Viewer

Every trace has a place on the track.

Explore 27 views through 29 application screenshots. Follow driving inputs, time losses, car behaviour and session analysis, then build your own worksheets and keep notes alongside the lap.

01/ 28Driving inputsScroll to explore

Driving

Driving inputs

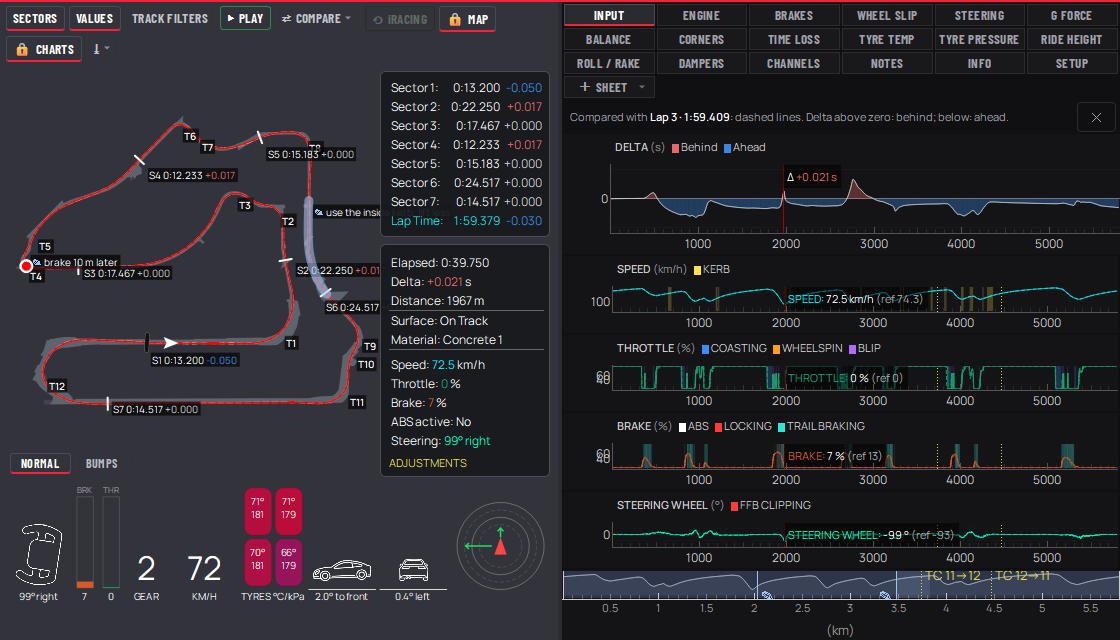
Input

Read speed, throttle, brake and steering together, with the same cursor on the track map.

What to look for

The comparison adds dashed reference traces and a cumulative time delta. Delta above zero means this lap is behind; below zero means ahead. Look at where braking, coasting and throttle application change.

Make it your own

Choose a comparison lap, move across a chart or the map, and zoom into the section you want to understand. Toggle sectors, values and track filters to keep the context useful.

Telemetry meets the replay

One moment. Every view in sync.

See telemetry and the iRacing replay at the same instant: connect the map position, charts and driving inputs with the action on track.

On-screen text: English.

Follow the braking zone.

Follow braking into the hairpin, the exit and the next braking zone. Then watch the ride-height and temperature tabs while the map, telemetry and iRacing replay continue to show the same instant.

38 secondsNo audioOpen in 1080p Use the player's fullscreen control to inspect the charts.

See the car respond to the track.

Read the four ride-height traces through a long corner, the full-throttle straight and the chicane, then explore roll and rake. Compare each trace with the car's position and movement in the synchronized replay.

55 secondsNo audioOpen in 1080p Use the player's fullscreen control to inspect the charts.

Synchronization requires iRacing with the matching session replay open, plus that session's .ibt recording in the viewer.

Driving

Braking

Brakes

Follow the application and release of the brake through a corner.

What to look for

Brake input, per-wheel pressure where available, and highlighted events help relate braking to speed. ABS cut shows the percentage of braking force removed according to the recorded ABS signal. Read locking and trail-braking markers alongside the underlying traces.

Make it your own

Compare laps at the same track location. Zoom from the braking point to the apex and inspect pressure differences between wheels when those channels are recorded.

Driving

Wheel slip

Wheel slip

Investigate how individual wheel speeds differ from the car's speed.

What to look for

Slip percentages are calculated from wheel speed relative to car speed. Positive slip can help locate wheelspin; negative slip can indicate locking. Values are suppressed at 30 km/h and below to avoid misleading low-speed ratios.

Make it your own

Use the shared cursor and comparison traces to relate an event to throttle, braking and steering. Treat slip as a derived indicator, with cornering and tyre behaviour in context.

Driving

Steering

Steering

Connect steering corrections, vehicle response and force-feedback demand.

What to look for

Inspect steering angle, yaw rate and available torque/FFB signals together. Clipping highlights the simulator's FFB signal near its limit; it is not a measurement of your wheel hardware's output.

Make it your own

Compare a corner against the reference and zoom into the initial input or exit correction. Pair the view with lateral G and balance to examine how the car responds.

Driving

G force

G force

See how braking, acceleration and cornering loads combine over the lap.

What to look for

Longitudinal, lateral and vertical acceleration put driver inputs and bumps in context. Compare the shapes and timing of the traces, rather than judging a lap from its highest peak alone.

Make it your own

Move the shared cursor to connect the G-force display with a place on the map. Isolate a corner and use the reference lap to examine differences in acceleration patterns.

Driving

Car balance

Balance

Investigate the relationship between steering, rotation and lateral load.

What to look for

Read the body-slip angle and the G-G diagram of lateral versus longitudinal acceleration. The understeer indicator is calibrated from typical behaviour within the lap: a relative aid, not an absolute measurement or an automatic setup diagnosis.

Make it your own

Compare similar corners and conditions, then inspect steering and slip at the same point. Use the setup comparison to see which recorded settings changed between sessions.

Driving

Corner analysis

Corners

Turn a full lap into specific braking, entry, minimum-speed and exit questions.

What to look for

The table summarizes each detected corner with timing, braking position and speeds. With a reference selected, differences show where the current lap improves or loses. The map keeps the corner's position visible.

Make it your own

Click a corner to zoom to it. Rename it, add one at the cursor, remove it or detect again. Corner definitions are shared by laps on the same track.

Driving

Where time is lost

Time loss

Find the corners and straights that explain the gap to your reference.

What to look for

Red bars show time lost and blue bars time gained over the same metres. The summary separates corners from straights; the table identifies entry or exit and differences in braking, coasting, minimum speed or throttle application. These are measured differences to investigate, not proof of a single cause.

Make it your own

Choose a reference lap, the fastest lap or the ideal lap when available. Click a bar or row to zoom into that section, then inspect the inputs and driven line. Corner definitions determine how the lap is divided.

Car & tyres

Engine & drivetrain

Engine

Put engine behaviour, gear choice and operating conditions next to the lap.

What to look for

Gear, RPM, fuel level, oil temperature and water temperature provide operating context. The reference fuel trace is aligned to the current lap's starting level, so it compares consumption, not initial fuel load. Available channels depend on the recording.

Make it your own

Compare gear changes and engine response with the reference. Open Channels when you want to inspect an additional recorded signal beyond this preset view.

Car & tyres

Tyre temperatures

Tyre temp

Follow the inner, middle and outer temperature channels for each tyre.

What to look for

The four tyre plots and cursor values show temperature patterns around the lap, alongside the reference when available. Interpret them with pressures, load and track conditions; a single sample is not a setup prescription.

Make it your own

Zoom into a corner or compare a whole lap. Use the session summary for lap-average temperatures and check which tyre temperature channels the recording provides.

Car & tyres

Tyre pressures

Tyre pressure

Compare how each tyre's recorded pressure changes through the lap.

What to look for

Read the four pressure traces at the same cursor position. Separate these running values from setup settings and the end-of-lap pressures shown in the session summary.

Make it your own

Switch between laps to investigate warm-up or a longer run. Use metric or imperial units from Preferences and compare laps with similar conditions.

Car & tyres

Ride height

Ride height

See how the car's clearance changes under braking, cornering and acceleration.

What to look for

Per-corner ride-height traces help locate compression and differences between the front and rear of the car. Low readings need the context of the car, surface and sensor channels.

Make it your own

Compare the same track section with the reference, then use the Platform worksheet or damper view to investigate a compression event.

Car & tyres

Roll & rake

Roll / Rake

Read the differences in ride height that describe the car's platform.

What to look for

Roll and rake are height differences in millimetres, not angles. Rake is average front height minus average rear height. The roll-versus-G scatter plot fits a response in mm/g; it does not directly measure suspension stiffness.

Make it your own

Use a reference lap and the shared cursor to connect platform changes to braking and lateral G. Inspect the underlying ride heights before attributing a change to setup.

Car & tyres

Damper histograms

Dampers

Compare how much time each damper spends in rebound and compression.

What to look for

Velocity is derived from suspension travel over the whole lap. Negative is rebound; positive is compression. The 25 mm/s split separates low- and high-speed shares. Dashed outlines add the reference. Zooming does not recalculate these whole-lap histograms.

Make it your own

Compare the four distributions and their percentages, then inspect ride-height traces for the time and place behind a difference. Histogram shape is evidence of motion, not an automatic damper-setting recommendation.

Track maps

Speed map & track layers

Track filters · Speed

Put the telemetry directly onto the circuit and choose which landmarks stay visible.

What to look for

Colour shows speed along the driven line. Sectors, corners, notes, braking points, kerbs and pit-lane context help connect a trace to the place it happened.

Make it your own

Open Track filters to choose the colour channel and switch layers on or off. Move the cursor over the map to update the charts and values at that position.

Track maps

Time gained or lost on the map

Track filters · Time gained/lost

Locate the track sections where the comparison changes.

What to look for

The map colours the local change in delta: where time is being gained or lost. The delta chart shows the cumulative difference. A lap can gain through one corner while still being behind overall.

Make it your own

Select a reference and choose Time gained/lost in Track filters. Follow the coloured section into the inputs or corner table to investigate the reason.

Session & setup

Your telemetry library

File details

Find a recording and check its context before comparing laps.

What to look for

The file list shows track, car, lap count, best lap, modification time and size. The detail panel adds the driver, session type, in-sim date and available weather information. These are details stored in the file, not current weather or a live session feed.

Make it your own

Choose your telemetry folder and search by track, car, driver or date. Hover a file to preview its details; click to open its laps. Personal records helps you revisit your best times by track and car.

Session & setup

Session laps

Session laps

Choose a completed lap with its sectors, session conditions and reference times in view.

What to look for

The lap table highlights the best lap and sector times. The ideal lap combines the best sectors from the file; it is a constructed reference, not a lap that was actually driven.

Make it your own

Open a lap in its own viewer, inspect the lap-by-lap summary or compare the setup with another file. The library also supports file search and personal records by track and car.

Session & setup

Lap-by-lap session summary

Session lap by lap

Look beyond the fastest lap and understand how the run developed.

What to look for

Compare lap times, fuel used, tyre data, conditions, incidents and pit activity. Tyre temperature is a lap average; pressure is read at the end. Charts leave out incomplete laps, laps through the pits and laps with refuelling, so gaps need context.

Make it your own

Use the table to choose comparable laps before opening the detailed viewer. Consider warm-up, fuel, traffic and track conditions when investigating a change in pace.

Session & setup

Setup comparison

Compare setup

See what changed in the recorded setups before interpreting a difference on track.

What to look for

The tree lists values from files A and B and their differences. Post-session readings such as tyre temperatures, hot pressures and tread are separated from actual settings and excluded from the change count.

Make it your own

Toggle Only what differs to focus on changes, or inspect the full tree. The second screenshot shows the complete view. Use the result with telemetry; a setting difference alone does not establish its effect.

Session & setup

Compare with the ideal lap

Compare · Ideal lap

Compare a recorded lap with a reference assembled from the fastest sectors in the file.

What to look for

Dashed traces join the telemetry of each selected sector; the delta and sector times reveal where your lap differs. This is a constructed reference, not a lap actually driven. Whole-lap damper histograms and roll-versus-G reference plots use the lap supplying the first sector.

Make it your own

In Compare, choose Ideal lap (best sectors) when available. Inspect the inputs and zoom into each loss, then switch to a real lap to check whether the sequence is repeatable under comparable conditions.

Your workspace

Recorded channels

Channels

Go beyond the preset tabs and inspect the signals available in your .ibt file.

What to look for

The channel list lets you plot recorded values beside the track map. Names and units help identify each signal; available channels vary across cars and recordings.

Make it your own

Search the list, select up to 6 channels and inspect them at the common cursor. Use the zoomed range when exporting the displayed channels to CSV.

Your workspace

Notes on the lap

Notes

Keep a driving observation or engineering question attached to the place that prompted it.

What to look for

A note marks either one distance or a selected stretch. The Notes tab lists the text and position, while map markers preserve the track context. Notes are saved locally for that recording and lap.

Make it your own

Press N or Add note at the cursor; zoom first to annotate a stretch. Click a note to return there, double-click to edit, or select Delete to remove it. Use notes to record what to test on the next run.

Your workspace

Focus on a section

Chart zoom

Turn a full-lap comparison into a close inspection of a braking zone or corner exit.

What to look for

Charts stay aligned as the visible range narrows. The map and cursor retain the track context, making it easier to examine timing and input differences together.

Make it your own

Drag across a chart to zoom; use Shift+drag or the wheel to move the range. Double-click or press 0 for the full lap; +/− also zoom. Map lock stops the map moving when hovering charts, while Charts lock keeps the range from following the cursor.

Your workspace

Braking worksheet

Sheet · Braking

Connect brake pedal use, speed-derived deceleration and cornering load in one configurable sheet.

What to look for

The example combines a deceleration trace, pedal-versus-deceleration scatter, a pedal histogram and brake versus lateral G. Its scatter plots and histogram keep samples above 5% brake and follow the zoomed stretch. Deceleration is calculated from speed; it is not a direct brake-force measurement.

Make it your own

Add the example sheets from + Sheet, then edit or duplicate one. Choose channels, formulas, filters, colours, trend lines and histogram bins. Math channels lets you define reusable formulas; check the input units before combining recorded and calculated signals.

Your workspace

Balance worksheet

Sheet · Balance

Compare the distribution of balance and steering activity across a lap or a single corner.

What to look for

The example relates the relative understeer indicator to lateral G and throttle, and plots understeer and steering-speed histograms. Grey points and dashed outlines show the reference. The second screenshot zooms into a corner: sample counts, averages and distributions update for that stretch and its filters.

Make it your own

Change the selected range or edit filters to isolate cornering and pedal conditions. Adjust axes, colour channels and histogram bins. Steering speed is the magnitude of the steering-angle change per second; the understeer indicator remains relative to the lap's calibration.

Your workspace

Platform worksheet

Sheet · Platform

Investigate how front and rear ride heights and rake vary with speed and load.

What to look for

The example plots axle-average ride heights, front height against speed, rake against speed and a rake histogram above 150 km/h. Scatter colours add longitudinal or lateral G. Trend lines describe the selected samples; they do not directly measure aerodynamic load or suspension stiffness.

Make it your own

Zoom into a section and change the channels, filters or formulas for your car. Rake is front height minus rear height in millimetres. Export shares all worksheets and math channels as a JSON workbook; import that workbook from + Sheet to reuse the analysis layout.

Actual application screenshots. Available channels depend on the car and the recording; controls can vary between versions.

Build your analysis

Start with the question you need to answer.

Use these routes as starting points. The links open the relevant views in this guide so you can see how the tools fit together.

Keep the analysis moving.

01One cursor across the lap

Hover a chart or the map to align the plots, location and gauges. The arrow keys move the cursor; Shift steps by one second and Ctrl by one sample.

02Play and revisit

Space plays the recorded lap. Home/End move to its ends and PgUp/PgDn switch to the previous or next lap in the same window.

03Link the iRacing replay

Open the matching session replay in iRacing to follow it. Ctrl+click a chart or the map to seek there; enable iRacing following to let the replay track the viewer's cursor.

04Leave useful notes

Press N to note the cursor position or the zoomed section. The Notes tab and map keep those findings accessible when you return.

05Export the evidence

Export the current tab's line-chart channels over the selected range to CSV. Save charts, the map or the window as PNG, or copy the window to the clipboard. A worksheet's Export shares the workbook and math formulas as JSON.

06Set up your workspace

Choose English or Spanish and metric or imperial units in the application. Closing the library keeps the app in the system tray; use Exit there when you want to quit.

Read the data

Make the comparison meaningful.

The viewer connects evidence. Your choice of laps and the data available in the recording still matter.

Compare like with like

Laps from other sessions, drivers or cars can be compared on the same track. Consider fuel, tyres, weather, traffic and track conditions before attributing a difference to driving or setup.

Recorded signals and derived indicators

Some channels are recorded directly; slip, balance indicators and roll/rake calculations are derived. Use them alongside the underlying traces and their units, not as automatic diagnoses.

Track outlines and the driven line

The map uses a supported circuit outline when available. On other tracks it can still show the recorded driven line. Use track filters to connect speed or local time gains and losses with corners, braking points and notes.

Tyre readings need context

Temperature and pressure availability depends on the car and recording. Lap summaries and setup comparisons show different kinds of readings; distinguish running values, averages, end-of-lap values and setup settings.

Good to know

Do I need iRacing running to inspect a file?

No. You can analyze recorded .ibt files locally. Following or controlling a replay requires iRacing with the corresponding session replay open.

Can I compare another driver's lap?

Yes, when you have their .ibt recording from the same track. Use Compare to select the file and completed lap, then inspect the dashed reference traces and time delta.

Does the ideal lap represent a real lap?

No. It combines the best recorded sectors from the file. It is a useful reference for investigating potential gains, not proof that the combined time was driven.

Can I share my analysis?

Export line-chart channels to CSV or save the charts, map or whole window as PNG. Share your worksheets and math formulas as a JSON workbook. Notes are stored locally and keep the context of a point or selected section.

Is this the MoTeC exporter?

No. IBT Replay Viewer is an interactive analysis tool. FB iRacing IBT is a separate product for converting recordings to MoTeC files.

IBT Replay Viewer

Make it part of your workflow.

Find out more about this product or manage your existing licences.

Account

Use ← → to browse and Escape to close.