All software

Formula 1 live & replay analysis

BoxBox-F1

Go beyond the broadcast.

For data analysts and people who want to see the whole race. Follow real Formula 1 live or replay historical sessions, then choose the timing, telemetry and strategy windows that answer your questions. Your drivers. Your comparisons. Your workspace.

Windows desktopReal Formula 1

BOXBOX-F1 / Real Formula 1

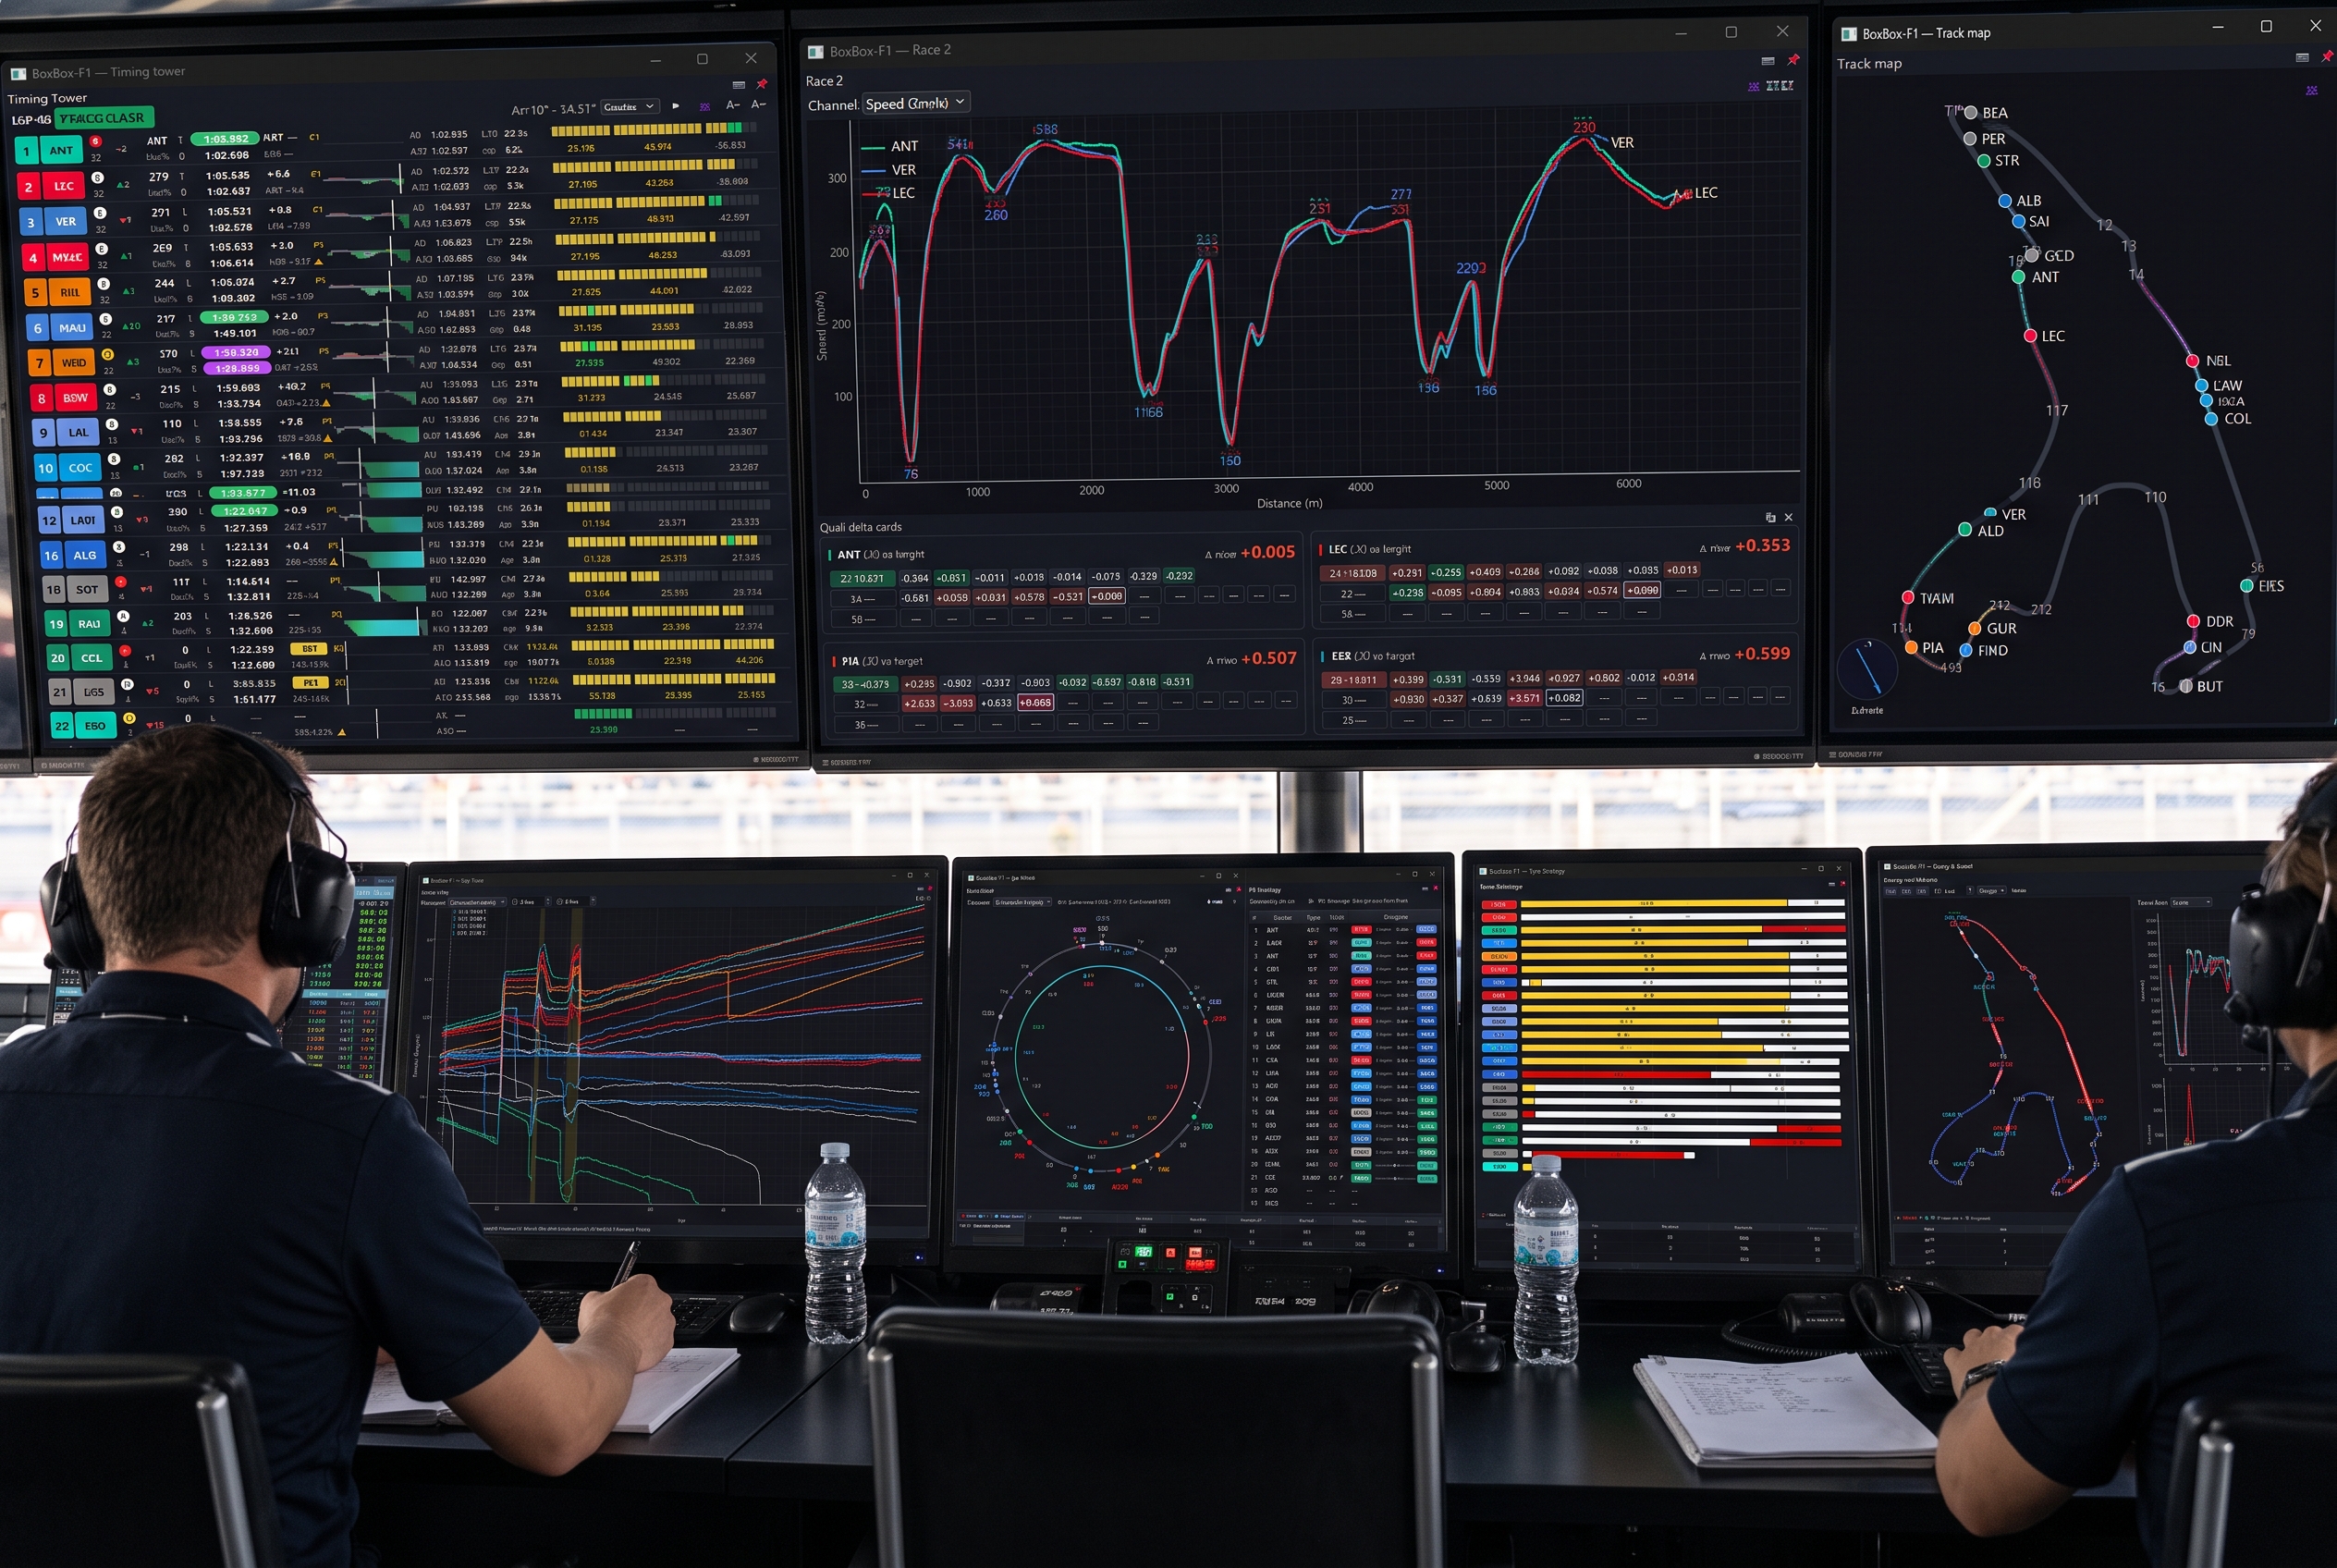
An entire race. Open to exploration.

Follow the battle as it unfolds, go back to the lap that changed it, or compare the traces behind a driver's pace. Each view has a job. Combine the ones that matter to you.

27
views & tools to explore
Your layout
independent windows
2018 →
historical sessions from 2018

Live & replay

Watch it live. Study it again.

Choose the source for your session. Timing, charts and maps follow the same playback moment, so revisiting a race keeps the story intact.

A live feed, your point of view.

The capture companion records the official stream while the viewer turns it into timing, maps and analysis. Rewind while capture continues, then use LIVE to return to the latest data.

The full live stream requires an F1TV subscription. Data arrives while an official session is running.

  1. 01

    Install the included Chrome extension and sign in with your F1TV account.

  2. 02

    Start capture during an official session and connect the viewer.

  3. 03

    Open the views you want; pause or revisit a moment without stopping capture.

A race worth looking at twice.

Choose a historical session from 2018 onwards, load its data and replay it from 1× to 25×. Pause at a braking zone or a pit stop and inspect all your views at that moment.

Historical coverage and available channels depend on the session's source data.

  1. 01

    Select the season, event and session in the control hub.

  2. 02

    Download the session on first use; the data is cached afterwards.

  3. 03

    Choose drivers, compare laps and move through the timeline at your pace.

Return to a session you captured.

Use the capture companion's import option to replay a saved .jsonl recording. The viewer receives the recorded sequence as if it were arriving live.

Import is an advanced option currently marked as debug in the capturer. Keep your original recording.

  1. 01

    Open the capturer and select the saved capture through Import.

  2. 02

    Choose the point where playback should begin.

  3. 03

    Connect the viewer and explore the session with your usual windows.

Inside BoxBox-F1

Find the view that answers your question.

Explore 27 views, from live timing to race strategy. Scroll through the screenshots and discover what each view shows and how to tailor it to your analysis.

01/ 27Timing towerScroll to explore

Timing & race

Timing tower

Timing tower

Keep classification, pace, gaps and tyre information together while following the field.

What to look for

Compare last and best laps, sectors, AVG5/AVG10, pit activity and steward notices. Click a driver to see rivals relative to that reference. The FREE marker is a projected stop without losing position.

Make it yours

Choose columns, filter drivers, change font size and sort by position or pace. Qualifying supports automatic, normal and manual Q1–Q3 grouping.

Telemetry & comparisons

Race chart

Race chart

Compare telemetry over part of a lap or across the session, aligned to the same places on the circuit.

What to look for

Speed, throttle, brake, RPM and gear traces show differences in braking, acceleration and corner exits. The horizontal axis follows track position, keeping the same corner aligned for each car.

Make it yours

Choose the channel and drivers in this window. Change the horizontal range from half a lap to the full session.

Telemetry & comparisons

Race 2 · one-lap view

Race 2

Keep a fixed lap on screen while each driver progressively replaces their previous trace.

What to look for

Crosshair values and labelled peaks help locate changes at a specific point. The linked track map shows where you are inspecting. This is a rolling view, rather than a chosen set of completed laps.

Make it yours

Select the telemetry channel and drivers independently. Move the cursor to compare values at the same track location.

Telemetry & comparisons

Live lap comparison

Lap Compare – Live

Measure a lap in progress against a target lap and see the difference build corner by corner.

What to look for

Compare the current trace with the dashed target, cumulative delta and sector/microsector cards. A positive delta loses time; a negative delta gains time. Each trace only extends as far as that car has travelled.

Make it yours

Choose drivers, channel and target driver/lap. Set or clear the reference as your comparison question changes.

Telemetry & comparisons

Completed-lap comparison

Lap Compare

Build a deliberate comparison from completed driver/lap combinations.

What to look for

The telemetry and cumulative delta reveal where a lap gains or loses against your target. Physical track distance aligns the comparison at the same corners.

Make it yours

Add or remove driver/lap pairs, choose the target set and change the displayed channel. Consider tyres, traffic and conditions when selecting fair comparisons.

Telemetry & comparisons

Times / Gap

Times / Gap

Follow the race-long difference to a reference driver, rather than just one lap's delta.

What to look for

The horizontal axis follows accumulated track distance with a divider for each lap. Positive values are behind the reference at the same position; negative values are ahead.

Make it yours

Choose the reference driver, the cars to compare and the range of laps displayed.

Telemetry & comparisons

Race trace

Race trace

Put changes in relative pace alongside stops, flags and neutralizations.

What to look for

Each driver's cumulative gap is sampled at official microsector positions. The vertical axis is inverted: positive gaps, behind the reference, appear lower; negative gaps appear higher. Shaded SC/VSC periods explain changes in context.

Make it yours

Use the leader or a selected driver as reference, filter cars and adjust the horizontal lap range and vertical range in seconds.

Telemetry & comparisons

Data tables

Data tables

Move from a visual pattern to the numbers behind it.

What to look for

Explore All data, Summary, By lap, Microsectors, Official µ, Corners and Degradation. The degradation slope is observed pace change in seconds per lap; fuel, traffic and conditions can also affect it.

Make it yours

Choose drivers, the lap range and the table. Official µ contains coloured feed statuses from live/capture data, distinct from calculated numeric microsector times.

Track & position

Track map

Track map

Locate the cars and understand where an event or comparison happens on the circuit.

What to look for

Positions, trails, corner labels, yellow sectors and a track-oriented wind compass connect the numbers to the track. Positions are projected onto the circuit outline, not a precise reconstruction of each racing line.

Make it yours

Filter the cars you want to follow and configure trails in the hub. Use the linked chart cursor to connect a trace with a location.

Track & position

Lap wheel

Lap wheel

See the field around a circular lap and make battles or potential rejoins easier to spot.

What to look for

Normal mode represents lap fraction. Gap mode spaces the cars by time, making groups stand out. The PIT ghost estimates where a selected car would rejoin after a stop.

Make it yours

Filter cars, choose a driver for the pit projection and switch between physical lap and elastic gap modes.

Track & position

Track dominance

Track dominance

Discover which selected driver was fastest in each part of the circuit.

What to look for

Each microsector takes the colour of the driver's best time through it across the completed laps you selected. This is a comparison of best segments, not average pace or current race order.

Make it yours

Change the driver set and lap range to explore a stint, a qualifying run or a specific comparison.

Pits & tyres

Pit lane

Pit lane

Separate the time travelling through the pit lane from the time spent stationary.

What to look for

Active visits stand out; earlier stops are dimmed with a laps-ago counter. PIT and STOP measure different intervals. Entry/exit compounds, official-time checkmarks and prolonged-stop warnings add context.

Make it yours

Filter cars and place the panel beside the timing tower or pit strategy to follow a stop from entry to rejoin.

Pits & tyres

Pit lane map

Pit lane map

Follow cars moving through the lane and dropping into their stop positions.

What to look for

Entry is on the left and exit on the right, with moving cars above and stationary cars below. Wheel colours reflect the compounds as the data arrives. This is a schematic view, not a measured garage map.

Make it yours

Filter the cars to keep in view and combine the animation with the pit-lane clocks for the numerical detail.

Pits & tyres

Pit strategy

Pit strategy

Explore the cost of a stop and the traffic a driver could meet afterwards.

What to look for

Net shows a virtual order accounting for pending stops. Rejoin shows projected position, neighbours and margins if a car stops now. The estimate is normalized to a three-second stationary stop.

Make it yours

Use the observed pit-loss estimate or enter a pit window in seconds and lock it. Read the observation count before relying on an automatic estimate.

Pits & tyres

Strategy Board

Strategy Board

See possible calls for each car and inspect the reasoning behind them.

What to look for

Verdicts such as BOX NOW, COVER, UNDERCUT or STAY combine observed race data with estimates. Tooltips explain assumptions and rejected alternatives. Current versions also open driver history and Plans A/B/C from a row.

Make it yours

Compare the proposed timing and traffic scenarios, and review pit loss in Pit strategy. Plan effectiveness percentages are relative model weights, not probabilities of winning or success.

Pits & tyres

Tyre strategy

Tyre strategy

Compare the tyre sequences and stint lengths that have shaped the race so far.

What to look for

Bars are coloured by compound and measured in laps. They stop at the current playback point, showing known tyre history rather than a forecast of future stops or remaining tyre life.

Make it yours

Move through the timeline to revisit the tyre picture at a decision point; combine it with gaps and pit strategy.

Pits & tyres

Tyre stints

Tyre stints

Keep a compact record of each driver's tyre use beside your main race views.

What to look for

Each stint chip shows compound and laps. A green N identifies a fresh set, making it easy to compare the tyre histories without opening the full strategy chart.

Make it yours

Scroll through the field and place this compact window where tyre context is most useful in your layout.

Conditions & analysis

Weather evolution

Weather evolution

Put a change in pace or strategy alongside the conditions during the session.

What to look for

Air and track temperatures, wind and shaded rain periods are plotted against the leader's lap. These are recorded conditions, not a weather forecast or proof of what caused a pace change.

Make it yours

Use the timeline and pair the view with tyre history or the race trace to investigate a specific period.

Conditions & analysis

Microsectors Editor

Microsectors Editor

Choose the sections of a circuit that make your comparison meaningful.

What to look for

Custom cuts let you isolate a corner, sequence or straight within each sector. Their numeric times are calculated splits, distinct from official sector timing and official coloured mini-sector statuses.

Make it yours

Drag cuts on the map or edit their distance in metres. Add or remove cuts, restore automatic placement or lock your changes. Settings are saved per circuit and year.

Conditions & analysis

Energy · deploy & coast

Energy – Deploy & Coast

Explore telemetry patterns associated with energy deployment reduction and lift & coast.

What to look for

Detected derate zones are red and lift & coast is cyan; charts summarize metres per lap. Related battery-balance views provide estimated indicators. These are telemetry-derived inferences, not a direct battery state-of-charge measurement.

Make it yours

Select drivers, laps and corners/straights; switch between per-lap and total views, toggle detected zones and choose optional trend lines.

Conditions & analysis

Dynamics · friction circle

Dynamics – Friction circle

Compare the balance between cornering, braking and acceleration in the selected data.

What to look for

Horizontal G is lateral, with left negative and right positive. Vertical G is longitudinal: braking below zero, acceleration above. Both are derived from the available telemetry; an envelope does not directly measure maximum tyre grip.

Make it yours

Choose drivers, laps and track zones. Toggle points and envelopes, use a 1:1 scale and adjust the axes independently.

Conditions & analysis

Dynamics · acceleration

Dynamics – Acceleration

Compare how positive longitudinal acceleration varies with speed and track location.

What to look for

Speed is on the horizontal axis and positive longitudinal G on the vertical axis. Braking samples are excluded. Patterns depend on the selected data and are not a measured engine power curve.

Make it yours

Select drivers, lap ranges and corners or straights. Add linear, quadratic or exponential trends when useful for the comparison.

Drivers & capture

Driver selection

Drivers

Start with the people you want to compare, then refine each window for its own question.

What to look for

The Drivers window seeds the comparison charts. It is not a mandatory global filter: a chart, the map or the tower can keep its own selection.

Make it yours

Select drivers individually or choose all. Then use each window's local driver controls to create different comparisons side by side.

Drivers & capture

BoxBox-F1 Capture

BoxBox-F1 Capture

Record the official live feed with a companion that runs separately from the viewer.

What to look for

The guided setup connects the included Chrome extension and your F1TV sign-in. Once connected, capture supplies the viewer while the session is live. Updating the viewer does not interrupt an active capture.

Make it yours

Start or stop capture, choose English or Spanish in the companion, and manage the sign-in when needed. Full live data requires F1TV and an active official session.

Timing & race

Timeline

Timeline

Move between the live story and the moment you want to understand. All views follow the same instant.

What to look for

Lap marks, pit-stop diamonds, flag and safety-car bands, rain and overtakes put events in context. Going back rebuilds the session state without revealing future events.

Make it yours

Pause, seek, jump by an interval or click a marked event. During capture, LIVE returns to the newest data while recording continues.

Timing & race

Race control

Race control

Read the official messages that explain what is happening on track.

What to look for

Follow flags, investigations, penalties, deleted laps and safety-car messages in chronological order. Colour helps identify the type of event; only messages known at the playback time appear.

Make it yours

Scroll the message history and pair it with timing or the race trace when investigating a sudden change.

Timing & race

Notifications

Notification settings

Choose which race events deserve your attention instead of watching every panel at once.

What to look for

The screenshot shows notification settings. Popups and the event log can highlight pit activity, fastest laps, stopped cars, flags, neutralizations, penalties and overtakes.

Make it yours

Enable popups and toggle event categories individually. Keep the signals you need for watching the race or studying a particular incident.

Real application screenshots. Some controls may differ between versions.

Your questions. Your arrangement.

Build your own side of the race.

Start with a suggested combination, then open only the windows you need in BoxBox-F1. Each window can have its own drivers and controls.

03 / Read the strategy

Look at pace, tyre history and the next stop together.

Combine race trace, tyre strategy and pit strategy. Open the Strategy Board to inspect assumptions behind a proposed call.

Suggested views

01Choose your windows

Use the hub's catalog to open the views you want. Closing a window hides it; it does not end the session.

02Arrange across monitors

Move windows freely. Magnetic snapping helps align them with each other and the screen edges.

03Keep the broadcast in view

Pin a window on top, remove its frame and adjust opacity to use it alongside your broadcast.

04Save the way you work

Use the supplied Race, Quali or Strategy profiles, or save your own arrangement. The layout is restored next time.

05Compare on your terms

Set drivers, channels and ranges per window. Different panels can answer different questions at the same time.

06Keep a finding

Take a screenshot of an individual panel for your notes or a later comparison.

Understand the data

Know what the numbers are telling you.

Useful analysis starts by separating reported data from reconstructed signals and projected outcomes.

Official timing and messages

Published lap and sector times take precedence when available. Race-control messages and coloured official mini-sector statuses are different from custom calculated splits.

Reconstructed telemetry signals

Custom microsector times, energy patterns and G forces are calculated from the available feed. There is no direct battery SOC channel; battery indicators are estimates. Feed resolution limits the detail you can infer.

Strategy and rejoin projections

Pit windows, rejoin positions and alternative plans combine observed conditions with assumptions. Inspect the reasoning and compare scenarios. Relative plan effectiveness is not a probability of success.

Comparisons need context

Traffic, fuel, compound, tyre age and weather can all change a lap. Select comparable runs before attributing a difference to a driver or interpreting a pace slope as tyre wear.

More analysis views

Current versions also include battery-balance estimates, G forces along the lap, grip-degradation views and per-driver strategy history with Plans A/B/C. Energy and dynamics remain derived indicators; tyre-plan projections depend on the known race length, remaining laps and dry-compound assumptions.

Data availability

Historical sessions use FastF1 data from 2018 onwards. OpenF1 can enrich sessions with grids, pit-stop times and driver photos. Coverage varies; some live-feed fields, including official coloured mini-sector statuses, are absent from historical replay data.

Good to know

Can I use it just to follow a race?

Yes. Begin with timing, a track map and the timeline. Add tyres or alerts when they help. The analysis windows are there when you want to go deeper.

Can I compare data without following live?

Yes. Load a historical session or revisit a recorded capture. Pause, choose driver/lap combinations and inspect comparisons at your own pace.

Are the views tied to one layout?

No. Each view has its own window. Move them across monitors, pin them, adjust opacity and save a profile. Driver selection and chart controls can differ between windows.

Does replay reveal later race events?

The views respect the current playback time. Stints, notifications and race information only show what is known at that moment.

What do I need for live data?

Windows, an internet connection, the capture companion and its Chrome extension. The full live stream requires an F1TV subscription and an official session currently running.

Is it for the F1 game or iRacing?

No. BoxBox-F1 works with real Formula 1 sessions. FB Racing's iRacing products are separate tools.

BoxBox-F1

Make it part of your workflow.

Find out more about this product or manage your existing licences.

Account

Use ← → to browse and Escape to close.